Aine E
Senior Product Designer


PMG DIGITAL MARKETING AGENCY
Product: Alli Artificial Intelligence tool
Role: Junior UI Designer/Developer
I was tasked with redesigning ALLI, PMG Digitals AI marketing tool. The objective was to meet our KPI of modernizing the user interface of ALLI by transitioning from the outdated Bootstrap design framework to the refined Ant Design library framework. These efforts aimed to improve the tool's usability and user engagement for our 50+ Fortune 500 brands, including NRG, Nike, and McAfee. I collaborated with stakeholders, development teams, and data engineers to design & strategize enhanced data visualization components and user flows that improved the cognitive understanding of how our users view and interact with data visualization, data insights, and metrics when using the ALLI application. Simultaneously, I strategized closely with UI developers to establish design system themes and patterns for data components.
ALLI Artificial Intelligence Tool, Audience Shifts


Discovery / User Problem
PRODUCT ROADMAP, USER RESEARCH, AND USABILITY TESTING
During the discovery phase, usability testing & user research sessions revealed that the current Bootstrap 4 framework lacked sufficient data visualization components and advanced interaction features, limiting the platform's intuitiveness. Additionally, testing highlighted the diversity in how users interpret data insights according to their specific needs. I worked with product management teams to develop a strategic roadmap aligned with the goal of:
Modernizing ALLI's user interface by transitioning from the outdated design library framework to the modern-day Ant Design Library, allowing the tool access to a variety of advanced data visualization components and interaction.
Improving accessibility and reducing cognitive overload by curating customizable, diverse ways to present data metrics and insights, ensuring the platform caters to all user needs.
Centralizing applications by migrating Audience Shifts into ALLI, encouraging users to use a universal tool that centralizes all applications into one.
-
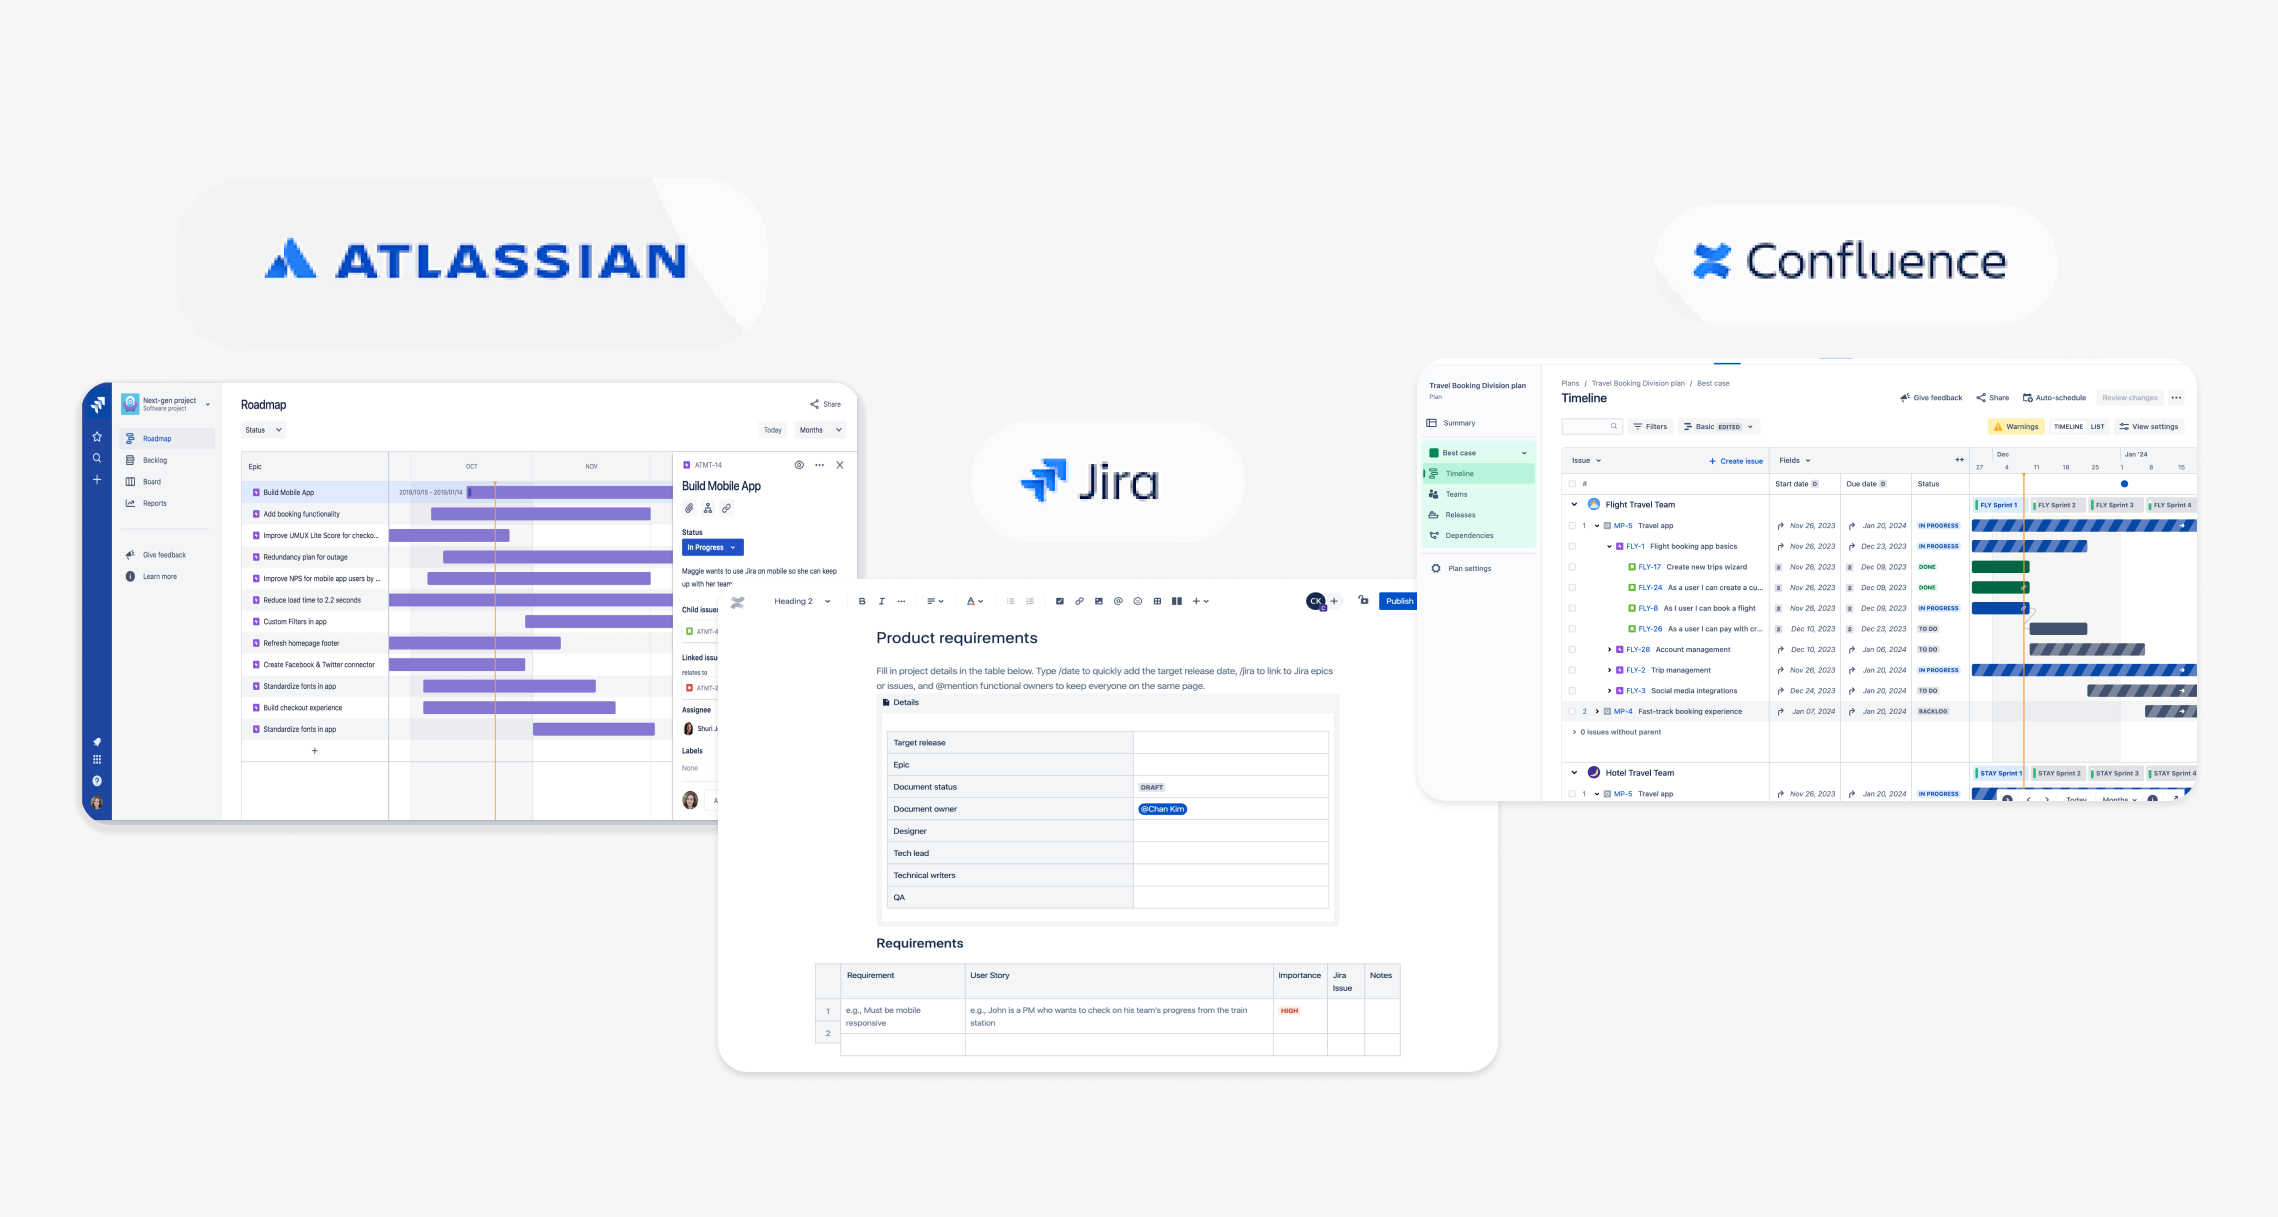
My product roadmap process involves close collaboration with a product management lead to define business goals and execute strategic objectives. Leveraging the JIRA platform, I recommend managing/tracking UX design and development deliverables within a two-week sprint cycle in an Agile/Scrum environment. Product requirements, sourced from executive directors, are translated into Confluence, where I analyze and structure them to develop an iterative product roadmap that prioritizes key metrics and user stories. The Roadmap is built at the Epic level and broken down into user stories and tasks that represent the business requirement.
Corresponding Figma files and Confluence documentation are iteratively mapped to JIRA tickets throughout the end-to-end product lifecycle, ensuring seamless alignment and traceability. A shared JIRA environment among cross-functional teams can foster efficient collaboration and goal alignment, delivering high-quality, user-centric solutions.

Ideation
WIRE-FRAMING, HIGH FIDELITY PROTOTYPES, DEVELOPMENT HAND OFF
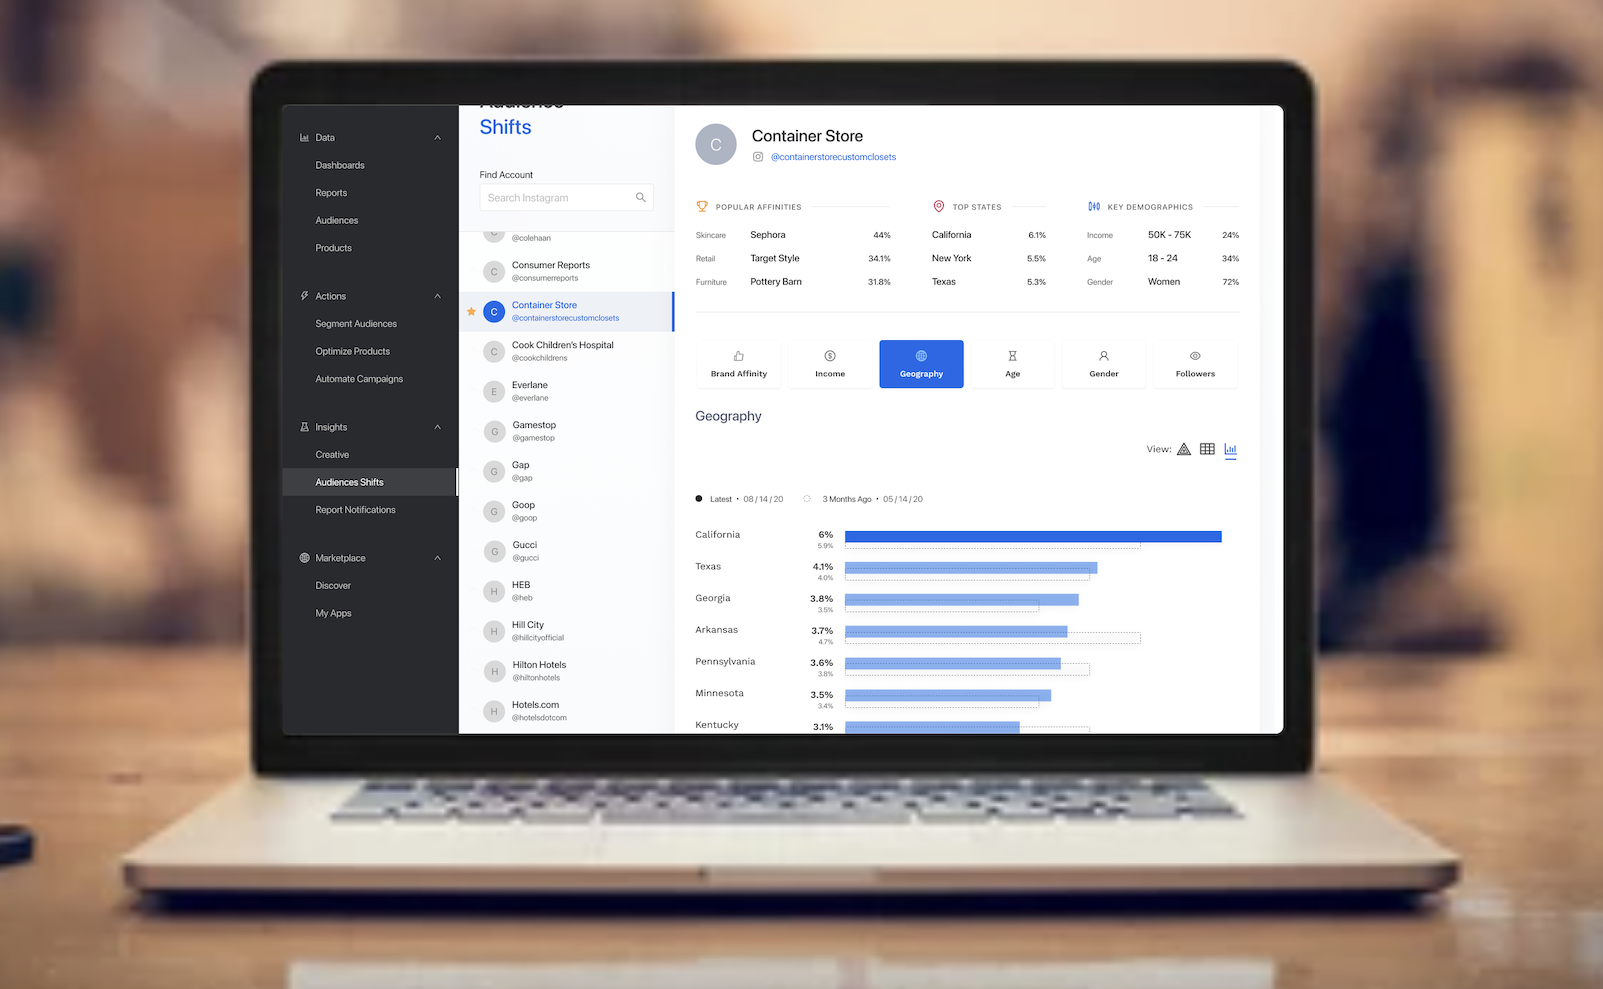
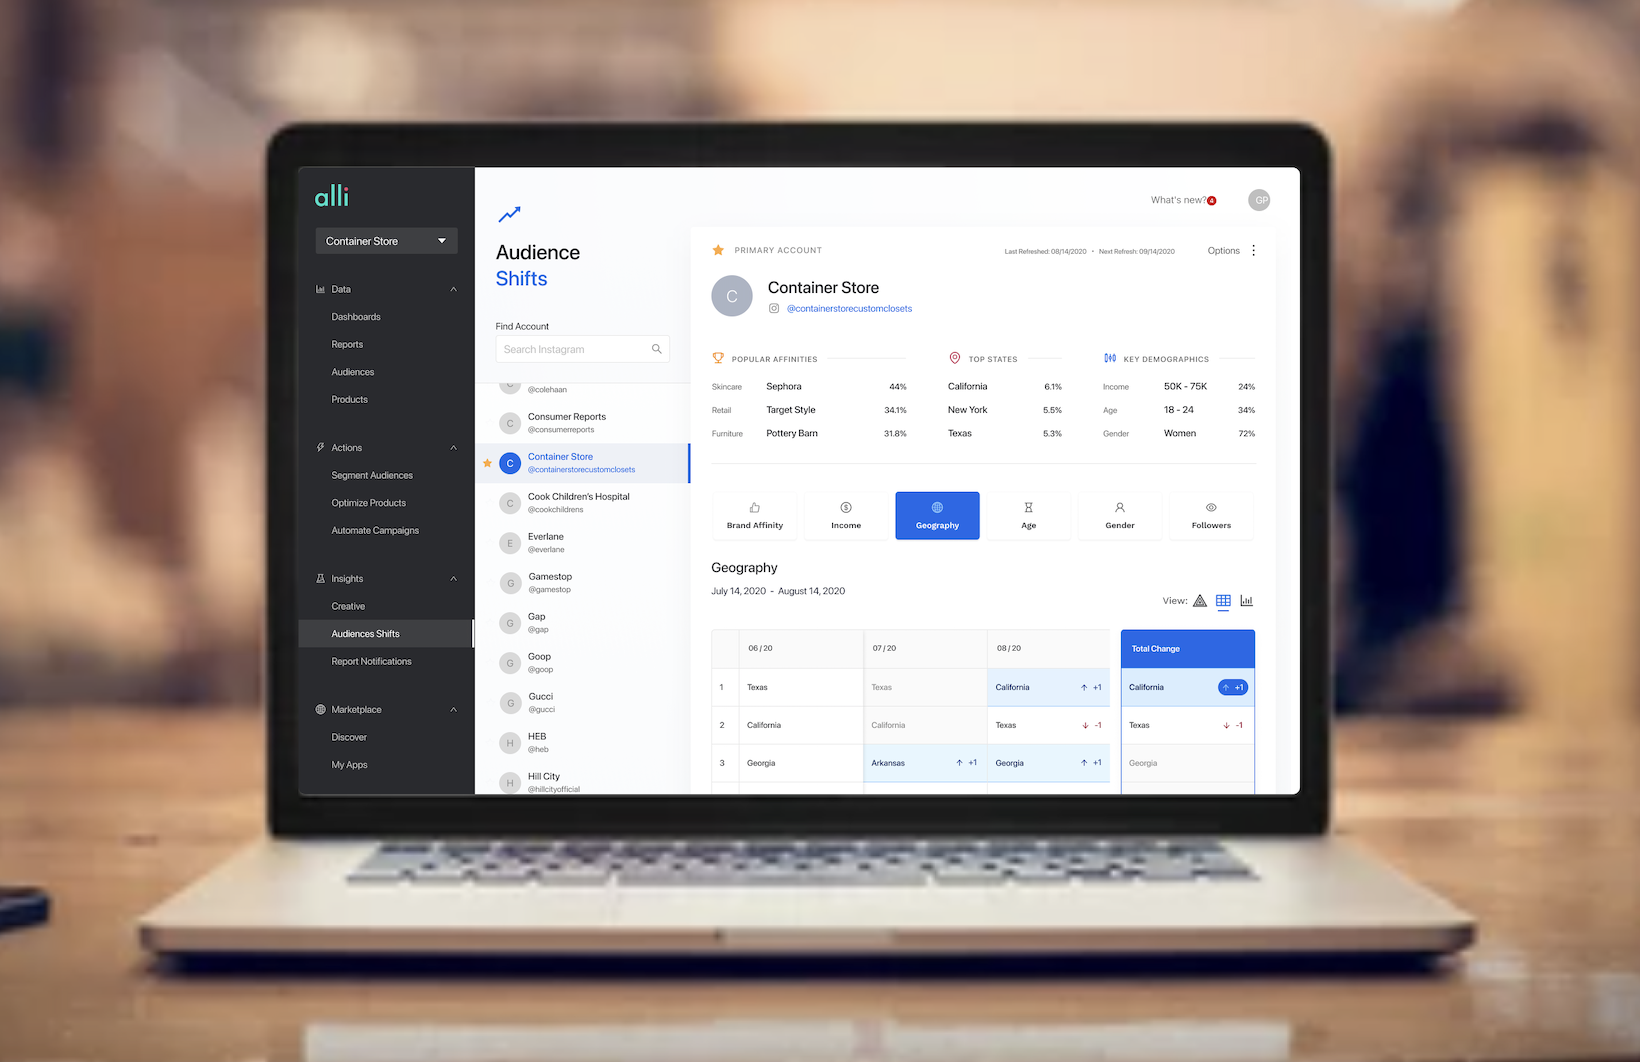
During the ideation phase, my role focused on strategizing and curating components and user flows leveraging the modernized Ant Design Library framework. Using Figma, I created advanced designs to redefine the user experience. One of the key projects I worked on was the Audience Shifts app, which originally functioned as a standalone application. It has since been integrated into the ALLI platform alongside other tools, creating a unified, centralized workflow for viewing, tracking, and managing data insights powered by artificial intelligence.
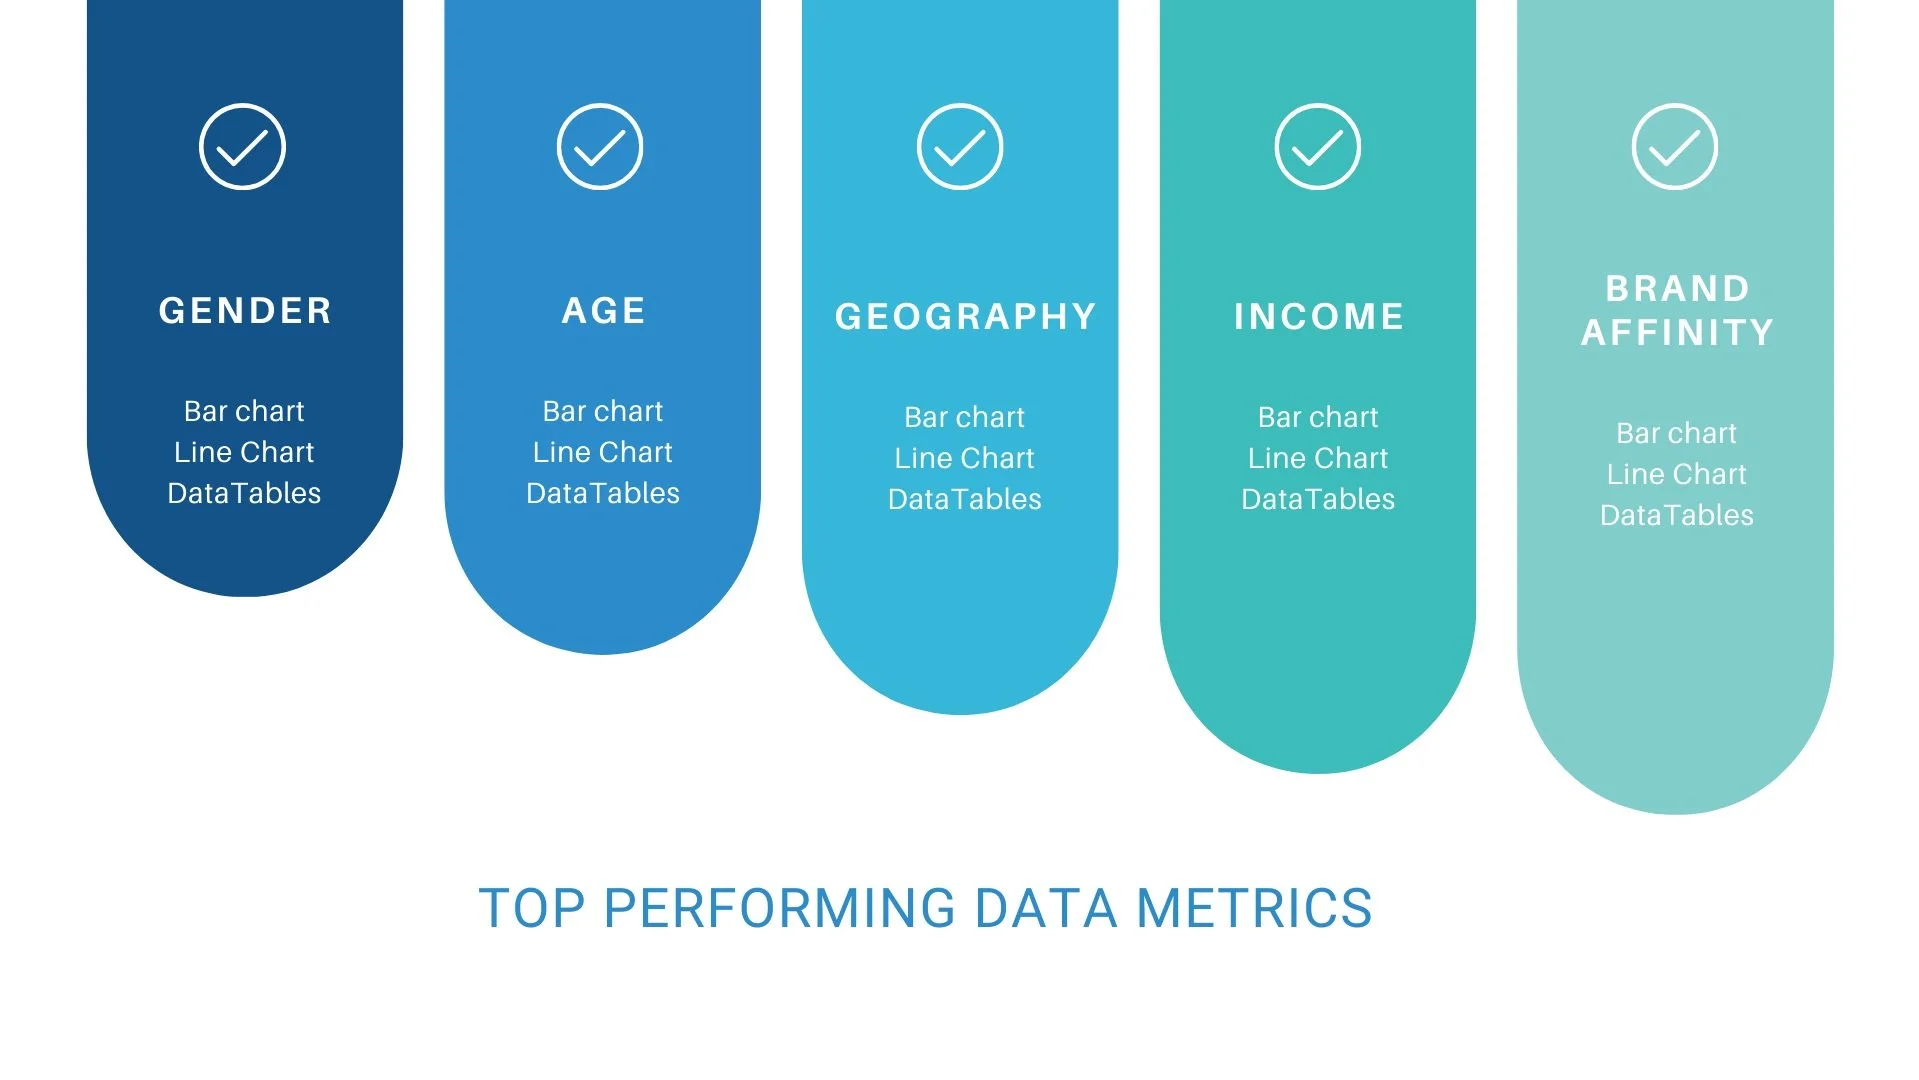
The original version of the Audience Shifts app was limited in its data visualization capabilities, relying primarily on basic data tables. I leveraged the new Ant Design Library to create advanced data tables, varieties of graphs, charts, and assembled data visualization components. These updates significantly enhanced the platform's ability to present insights in diverse and inclusive ways that improved user interaction and users decision-making.
-
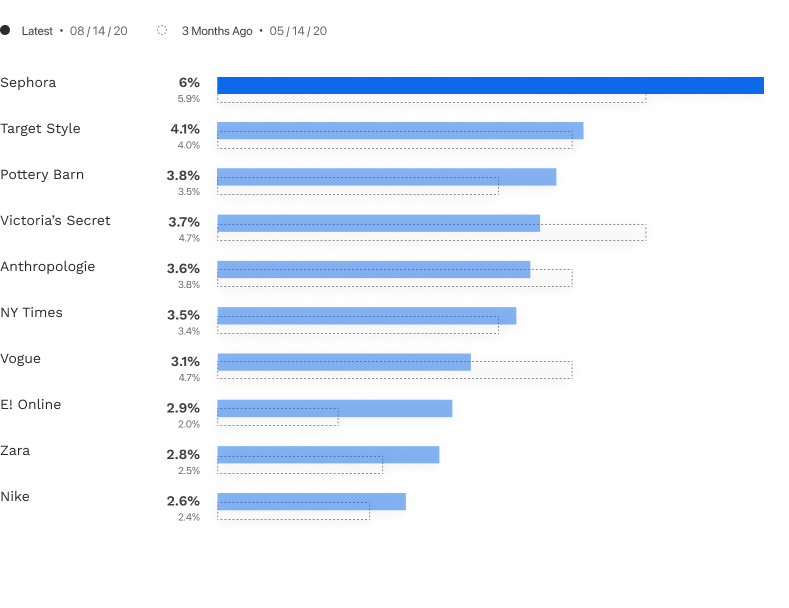
Bar charts are designed to accomodate two layers, with the top layer (solid fill) representing the latest recorded month’s data. If historical trend data is available, a second layer would appear beneath as an outlined bar. This would reflect the ‘trend’ time selection, such as 3 months prior or 6 months prior.
-
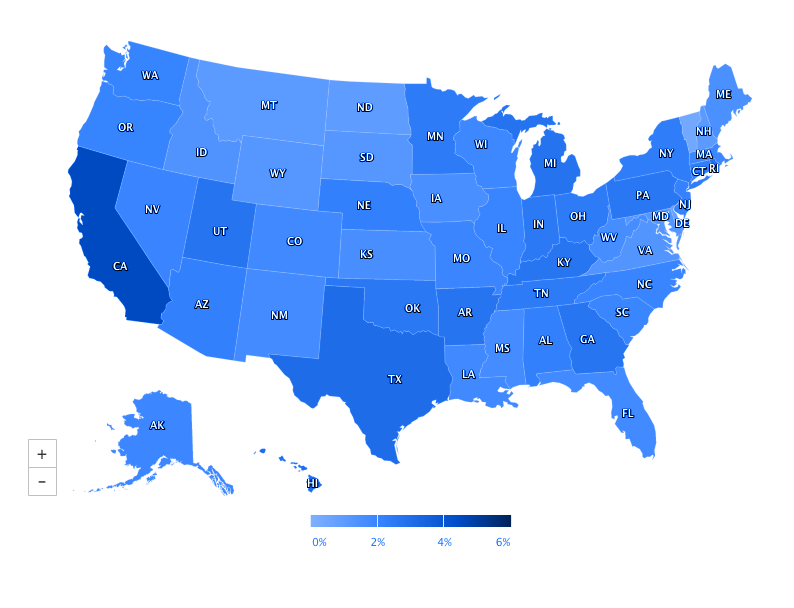
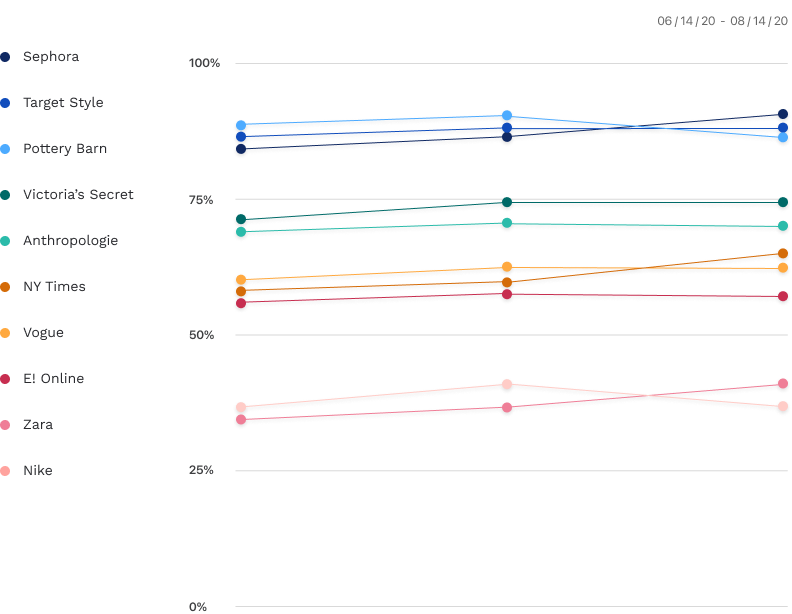
Percentage-stacked area charts were used to emphasize a variation of charts where each data series is visualized as a running percentage of the total. The goal is to enhance how users visualize data proportions, ideally for showing how different categories contribute to the total percentage over time or across categories. Users can now view the market share of different brands shifts from year to year.


Outcome
View interactive prototype via Figma.
The Audience shifts application was succesfully migrated into the ALLI platform. Centralizing single applications into one central tool provided rapid benefits. Switching to the modern Ant design library improved accessibility, increasing user engagement by over 45%. Increasing the use of data visualization components by 30 % reduced cognitive load and improved how users digested data insight/metrics.